About COVID-19
Viruses and Bacterial Diseases Do Not Respect Borders
COVID-19 is a novel coronavirus first identified as a causative infectious agent for respiratory disease in Wuhan, China in late November, 2019. (Lancet. 2020 Feb 15;395(10223):497-506. doi: 10.1016/S0140-6736(20)30183-5. Epub 2020 Jan 24.). In the intervening time, COVID-19 has become a global pandemic with transmission occuring on all continents except Antarctica. The following paragraphs briefly introduce important information about Coronaviruses and COVID-19.
COVID-19 Is A Virus
Coronaviruses include a common cold virus, and more lethal viruses causing SARS, MERS, and COVID-19. Coronavirus members are enveloped viruses (they have a lipid membrane outer coat) to which the envelope (E) protein and structural proteins (S) are anchored. This is why Coronavirus images show a circular ball with the structural proteins as "spikes" on the surface. Coronaviruses have relatively large RNA genomes instead of DNA.
Why Will Antibiotics Not Work On COVID-19
Viruses cause disease by infecting a host cells and using that cell to replicate themselves. Viruses are not living organisms in the sense of having metabolism, replication, and reproduction capabilities outside a host cell. Almost all antibiotics target metabolism, replication, and reproduction of living cells, so antibiotics are not effective treatments for viral infections.
Treatment of Respiratory Distress
COVID-19 infection results in cold-like symptoms including dehydration, fever, cough, and fatigue. In mild cases, only routine over-the-counter medications are necessary to manage symptoms. Unfortunately, COVID-19 can damage the lungs and respiratory system, causing life-threatening Respiratory Distress in infected patients. Treatment for Respiratory Distress requires supplemental oxygen and potentially a respirator for patients having difficulty breathing.
COVID-19 HotZones
How do you find HotZones?
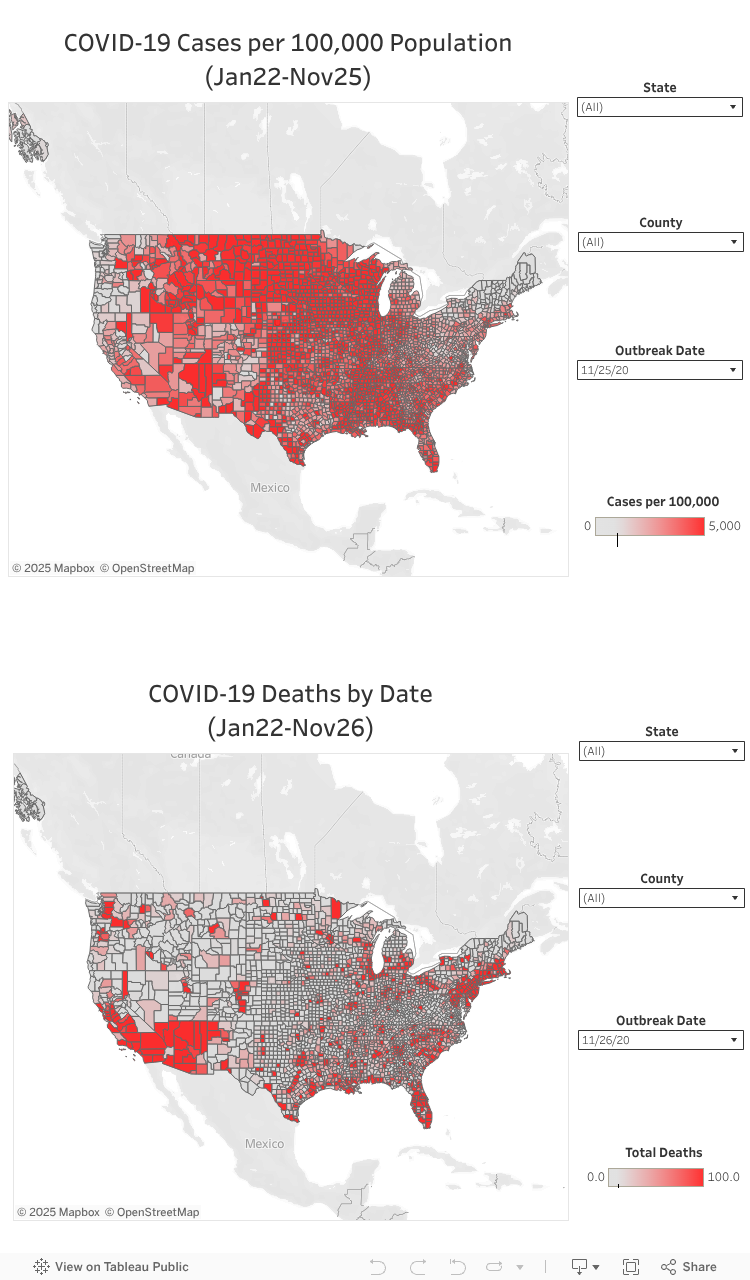
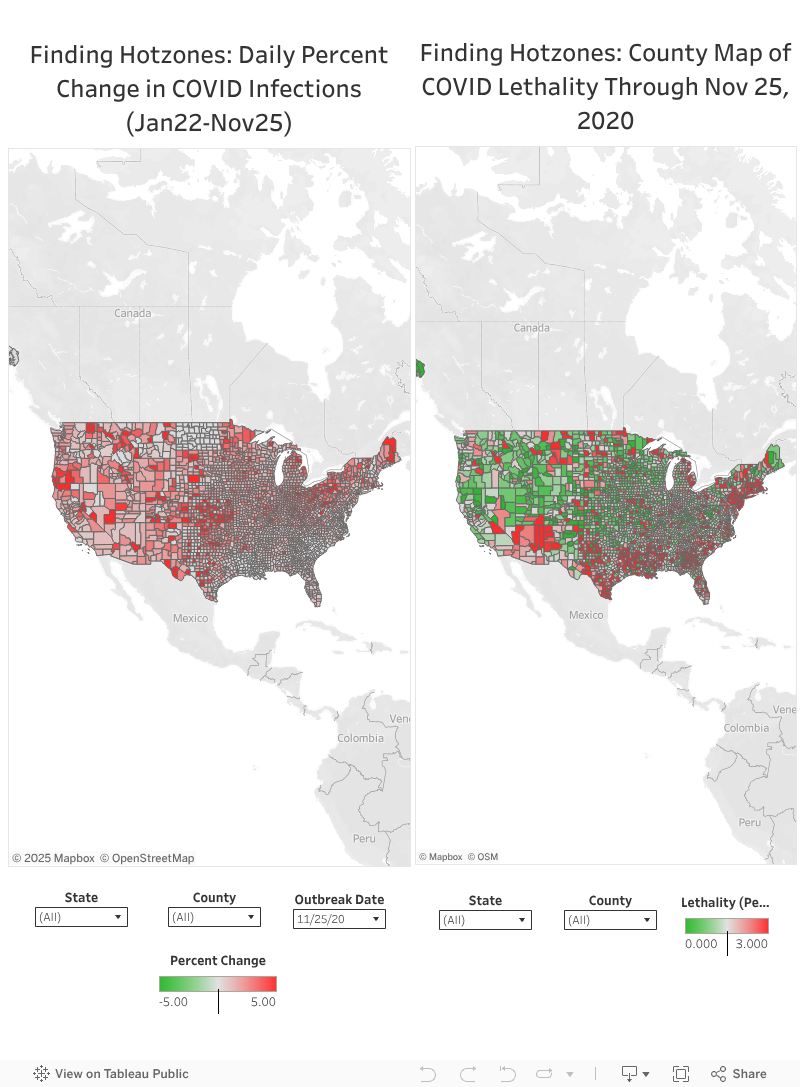
A critical question during an infection outbreak is how quickly the number of infections and deaths in a localized geographical region or population center are increasing. This information directly identifies a "HotZone" area. Early detection of a hotzone provides time-critical opportunities to mobilize healthcare workers, import medical equipment and medications, control the spread of disease, and save lives. In the previous InfoPage, the number of infections was reported directly, which does not account for population. This has been corrected to report the percent change in number of infections (Number of Infections (Day N) - Number of Infections (Day N-1) divided by Number of Infections (Day N-1)). I have tried to add a different perspective for defining a HotZone by mapping the Lethality of COVID-19 Infections on the county map of the United States. In this map, the counties and regions with higher lethality can be identified geographically. As noted in an earlier version of the COVID-19 InfoPage (6/28/20), the Midwest and Southeastern United States have indeed become significant regions for COVID-19 infections and deaths, as seen in these maps and the COVID-19 Cases per 100,000 Population and COVID-19 Deaths by Date maps above.
COVID-19 Lethality
How do you define Lethality?
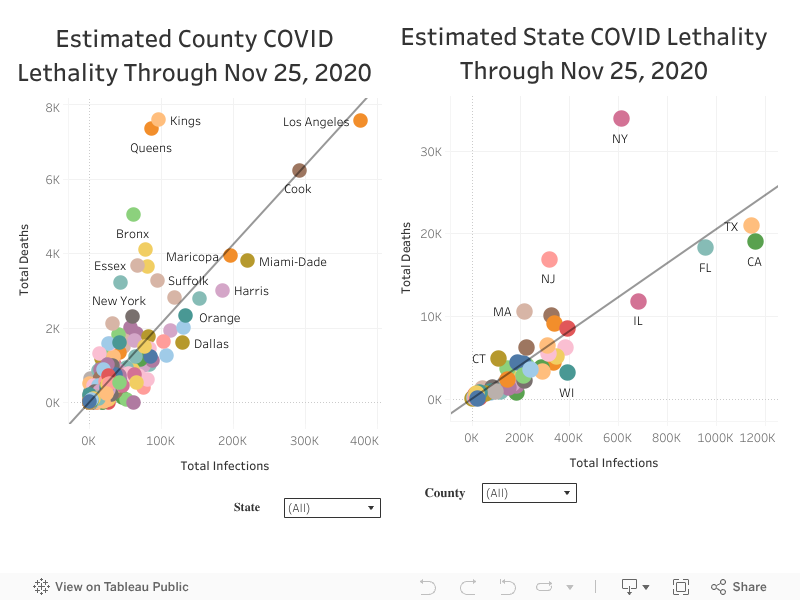
Another critical question about HotZones concerns infection lethality. While there are complex models for calculating the lethality of an infection outbreak, often the most direct method provides the clearest visual representation. The approach used here defines lethality as the number of fatalities divided by the number of infection events and the value multiplied by 100 to produce a percentage. The scatter plots below show the lethality percentages for counties and states through 11/25/2020, the most recent day of the outbreak. An important limitation of the county data is that county names may be shared by multiple states. This can be visualized by choosing specific counties in the drop-down menu, which shows the county in the County scatterplot and the states with that county name in the State scatterplot.
COVID-19 Infections Change Map
The map above visualizes the percentage change in number of infections over the course of the COVID-19 outbreak by day. The filter boxes allow for filtering by State, County, and the specific Date of the outbreak. As noted in the earlier COVID-19 InfoPage, the Midwest and Southeastern US have become major epicenters for the US COVID pandemic: The Southeastern US from about 6/2020-8/2020, and the Midwest is in a current expansion of the outbreak. It is informative to compare with the normalized data in the About COVID-19 Section above.
COVID-19 Lethality Map
In the previous COVID-19 InfoPage, quantitative information on average increase or decrease in percentage change of infections was represented using a bar-chart. This was not informative as to where HotZones were likely to occur, so this new InfoPage has mapped the Lethality of COVID-19 infections onto the countywide map of the United States. Significant concentrations of lethality are seen in the Southeastern United States and signficant numbers of counties in the Midwest. The lethality in the Eastern and Western United States has not changed significantly since the earlier phase of the pandemic.
Estimation of Lethality
A critical measure in an infection outbreak how many of the infections will result in death? These scatter plot visuals indicate lethality as of 11/25/2020. The slope of the trend line indicates the lethality and is observed by hovering the mouse over the trend line. Hover over each circle for data on that county (Left Scatterplot) or state (Right Scatterplot). The average lethality can be derived from the trendline, where the VALUE*Total Infections is reported. VALUE is the slope of the line and represents the lethality (for example, 0.0204868*Total Infections indicates a 2.049% lethality rate).
COVID-19 Cases (US)
COVID-19 Deaths (US)
COVID-19 Cases (Global)
COVID-19 Deaths (Global)
Team
Our Hard Working Team
Currently, I am the sole worker on the COVID-19 InfoPage. Please contact me if you would like to contribute.

Steven J. Bark, Ph.D.
Scientist and Data AnalystF.A.Q
Frequently Asked Questions
Frequent myths and misconceptions about COVID-19 and viral diseases.
-
Isn't COVID-19 no worse than the flu?
Influenza is a predictable and well-understood threat that can be very dangerous in susceptible populations. The mortality for flu is approximately 0.1% by reliable estimates. COVID-19 is neither predictable or well-understood. From data during this pandemic, mortality for COVID-19 varies widely based on country and patient demographics. Best estimate data from CDC indicate mortality rates as high as 5.4% in elderly populations, which is MANY, MANY times higher than influenza. Younger populations have much lower mortality rates similar to influenza, but with catastrophic fatal infections not uncommonly observed. More disturbingly, the long-term morbidity from COVID-19 appears to be non-trivial with cardiovascular and respiratory damage persisting after recovery from the virus itself. The preponderance of current data demonstrates that COVID-19 is a highly transmissible virus that presents a manifest threat to susceptible populations including people of advanced age, compromised immune systems, and chronic illnesses including Diabetes, COPD, Heart Disease, and Cancer. (https://www.cdc.gov/coronavirus/2019-ncov/hcp/planning-scenarios.html)
-
Isn't there a vaccine for Coronaviruses?
The recent developments of multiple vaccines for SARS-CoV-2, the virus that causes COVID-19, is exceptionally good news. The Pfizer/BioNTech and Moderna vaccine candidates are based on mRNA technologies. These vaccines use a messanger RNA that codes for the cells in your body to synthesize pieces of the SARS-CoV-2 proteins. Johnson & Johnson and AstraZeneca are proceeding with viral vector vaccines. These vaccines use an inactivated virus that expresses SARS-CoV-2 proteins on the surface of the virus. Novavax and Sanofi with GSK are using a recombinant protein vaccine approach, which uses the actual proteins from SARS-CoV-2 (usually the spike protein). Regardless of the vaccine approach, all of these vaccines introduce proteins from the SARS-CoV-2 virus into your body to be recognized by your immune system. After vaccination, your immune system will be primed to recognize and rapidly eliminate the real virus. The initial studies indicate 90%+ effectiveness for the Pfizer/BioNTech and Moderna vaccine candidates. The AstraZeneca vaccine candidate study has been beset by methodological problems with how the study was conducted. However, the reported 70% effectiveness would provide effective protection against the virus sufficient to control the pandemic. Importantly, the Pfizer/BioNTech and Moderna vaccines require storage and transport at -80 degrees Celsius. The AstraZeneca (and potentially the Johnson & Johnson vaccine candidate) can be stored and transported at standard freezer conditions.
-
What about antiviral drugs like for HIV or Flu?
While antibiotics are not effective against viruses, there are antiviral drugs like Reverse Transcriptase and Protease inhibitors for HIV or Tamiflu for Influenza A and B. Unfortunately, viruses have very different life cycles and use very different proteins to take over the host cell metabolism and replicate themselves. Because of these differences, antiviral drugs effective against one type of virus are ulikely to be effective against other types of viruses. It is very important to have antiviral drugs that target proteins important for the specific virus causing the infection. This problem is not limited to viruses. Many pathogenic bacteria have become resistant to available antibiotics. The development of new antiviral drugs and antibiotics is a critical objective for future biomedical research.
-
Will disposable masks protect me from COVID-19?
This subject has been studied extensively and the data are clear. Disposable masks are effective at blocking the small droplets expelled by people coughing or sneezing. Importantly, masks are most effective at blocking these aerosol droplets for the person wearing the mask. Wearing your mask will protect the people around you. Likewise, the people around you wearing their masks will protect you. As a precaution against Coronavirus (and many other viruses or bacterial infections), a routine disposable mask will protect people around you from your coughing or sneezing IF THE MASK IS THE APPROPRIATE TYPE AND FITTED PROPERLY. In addition to masks, the most effective protection is to avoid people coughing or sneezing, especially in enclosed environments like public transportation and office spaces. The more effective N95 masks provide more effective protection against these droplets, but are best utilized by health workers caring for patients exhibiting infections from unknown biological agents.
-
Are these mask mandates, lockdowns, and social distancing a tyranical overreach of government?
Infectious agents including viruses and bacteria do NOT care about your personal liberties. The primary mode of transmission of any infectious agent is exposure to infected people. Mask mandates, quarantines, lockdowns, shelter-in-place, and social distancing are highly effective epidemiological methods that limit your exposure to people that knowingly or unknowingly harbor viral or bacterial infections. These infection control measures ARE NOT focused on limiting your personal liberties. These infection control measures ARE focused on reducing the number of people becoming infected and requiring medical interventions. Advanced medical interventions including ICU and ventilators save lives, but too many patients can overwhelm limited available medical space and resources. Surprisingly, the larger protest gatherings against the lockdowns that have been televised from Michigan, Ohio, Kentucky, and other states over the Summer did not appear to produce large-scale COVID-19 transmission. Neither did the protests over the death of George Floyd and others across major cities in virtually every state. In retrospect, these protests were outdoors and not confined to indoor venues. In contrast, large-scale social gatherings confined to indoor venues and without mandatory masks and social distancing have resulted in increased transmission of SARS-CoV-2 virus.
-
Why were there some changes in the data processing on this page compared to earlier InfoPages?
My initial focus in creating this InfoPage was on direct visualization of COVID-19 infection data. During the course of this outbreak and after communication with scientific and non-scientific members of communities that have contacted, me, my focus has shifted to represent these data in a more rigorous manner. Therefore, the COVID-19 Cases are corrected for population to enable direct comparison of counties across the United States. The Finding HotZones Section now calculates the daily change in number of infections as a percentage from the previous day. This enables more effective comparison of infection trajectories across counties exhibiting wildly-differing populations. The COVID-19 Lethality Section was suggested from several communications to provide a direct approach for readers to consider how lethality is measured.
-
What has changed since the last update of the COVID-19 InfoPage?
Since 6/28/20, COVID-19 has become a major "out of control" worlwide catastrophe. Focusing on the United States, the COVID-19 InfoPage has taken the US perspective. The COVID-19 Cases per 100,000 Population has normalized the infection data to population, allowing for direct comparison between counties of different populations. I have had to adjust the scale of this mapping because the number of infections per 100,000 population has become almost astronomically higher across the Midwest. The COVID-19 Deaths by Date remains a simple measure of number of deaths in each county reported in the data. I have taken a different approach to the question of Hotzones. Instead of a bar-graph, I have mapped the Daily Percent Change in COVID Infections on the county map of the US. This provides not only a measurement of the percent change in infections, but a geographical representation of these data. You can interrogate this by looking at the Finding HotZones map, enlarging on counties of interest, and hovering over them with your mouse. You can also select the State, County, and Outbreak Date on the map. Replacing the bar-graph, I have added a County Map of COVID Lethality through 11/25/2020, the last date reported in my dataset. This map provides a geographical representation of counties based on their estimated lethality as calculated by #COVID-19 Deaths/#COVID-19 Infections. These ideas are also observed in the Estimated County COVID Lethality and Estimated State COVID Lethality graphs. These data indicate a new idea for defining Hotzones in relation to increased lethality of infections during the pandemic. In the future, I will incorporate pandemic dates to define time-resolved changes in lethality. IMPORTANT! Evaluating the current outbreak requires us to understand the difference between the initial outbreak and the mature outbreak we are now confronting. Let me present an example. In the initial days of COVID-19 outbreak, 200 new infections would be a 10% increase when only 2,000 infections were reported on the previous day. In a mature outbreak (what we are currently confronted with), we have 2,000,000 infections reported. A 10% daily change based on these number of infections would be 200,000 additional infections over the previous day! A 1% daily change would be an increase by 20,000 infections, or 10 times the number observed in the early outbreak. It is of critical importance that evaluation of current trends in this outbreak are based on proper understanding of the data.
-
New Question for the FAQ?
Contact me and propose your questions for the FAQ!
Contact
Check our Contact Details
Location:
Clear Lake, TX 77059
Email:
stevenjbark@gmail.com
Call:
+1 858-336-4039